Tracking number portability activity in New Zealand
Overview
Ported number activity and trends
Every week, the industry handles almost 10,000 porting events, requiring changes to network routing for 12 different networks and updated records and call handling for more than 30 providers; all ensuring that the vast majority of users can use their new service with their old number within a matter of hours.
The TCF tracks the porting of numbers month to month, and displays the results here on a quarterly basis.
Number of ports per month
Up to December 2025
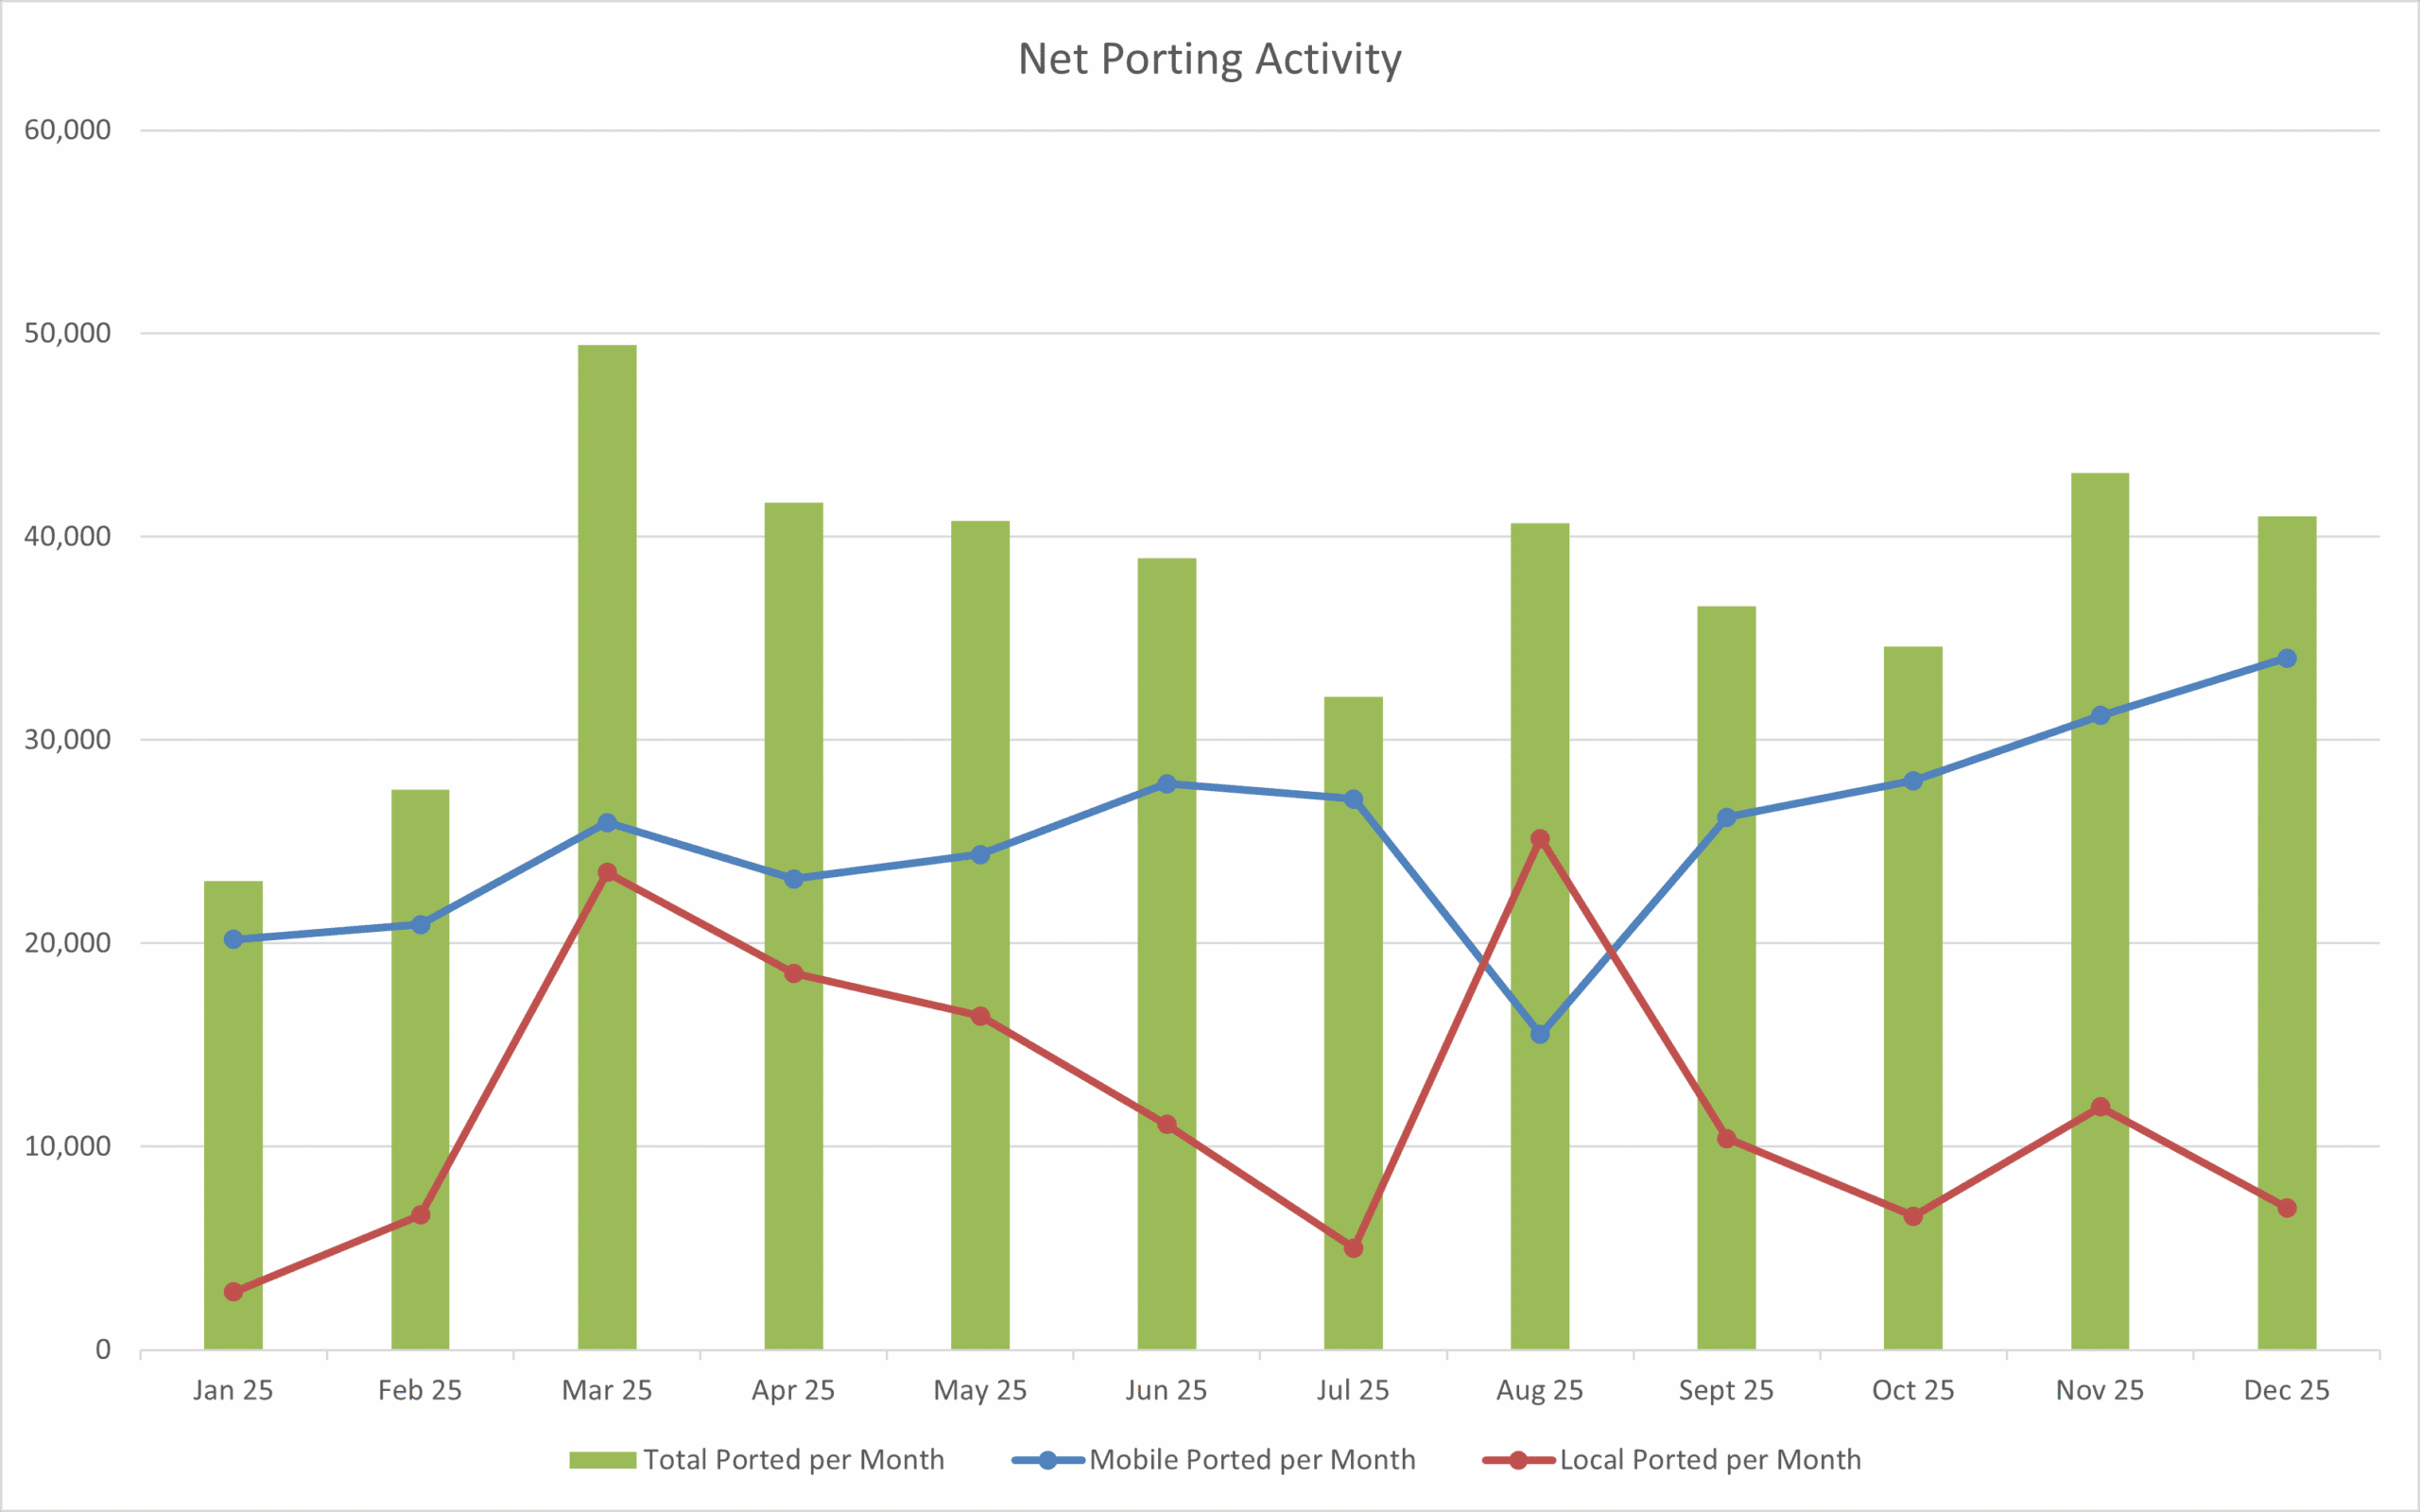
This is a count of all the mobile and local ports that have occurred during each month, including of previously ported numbers.
Cumulative count of numbers ported since 2007
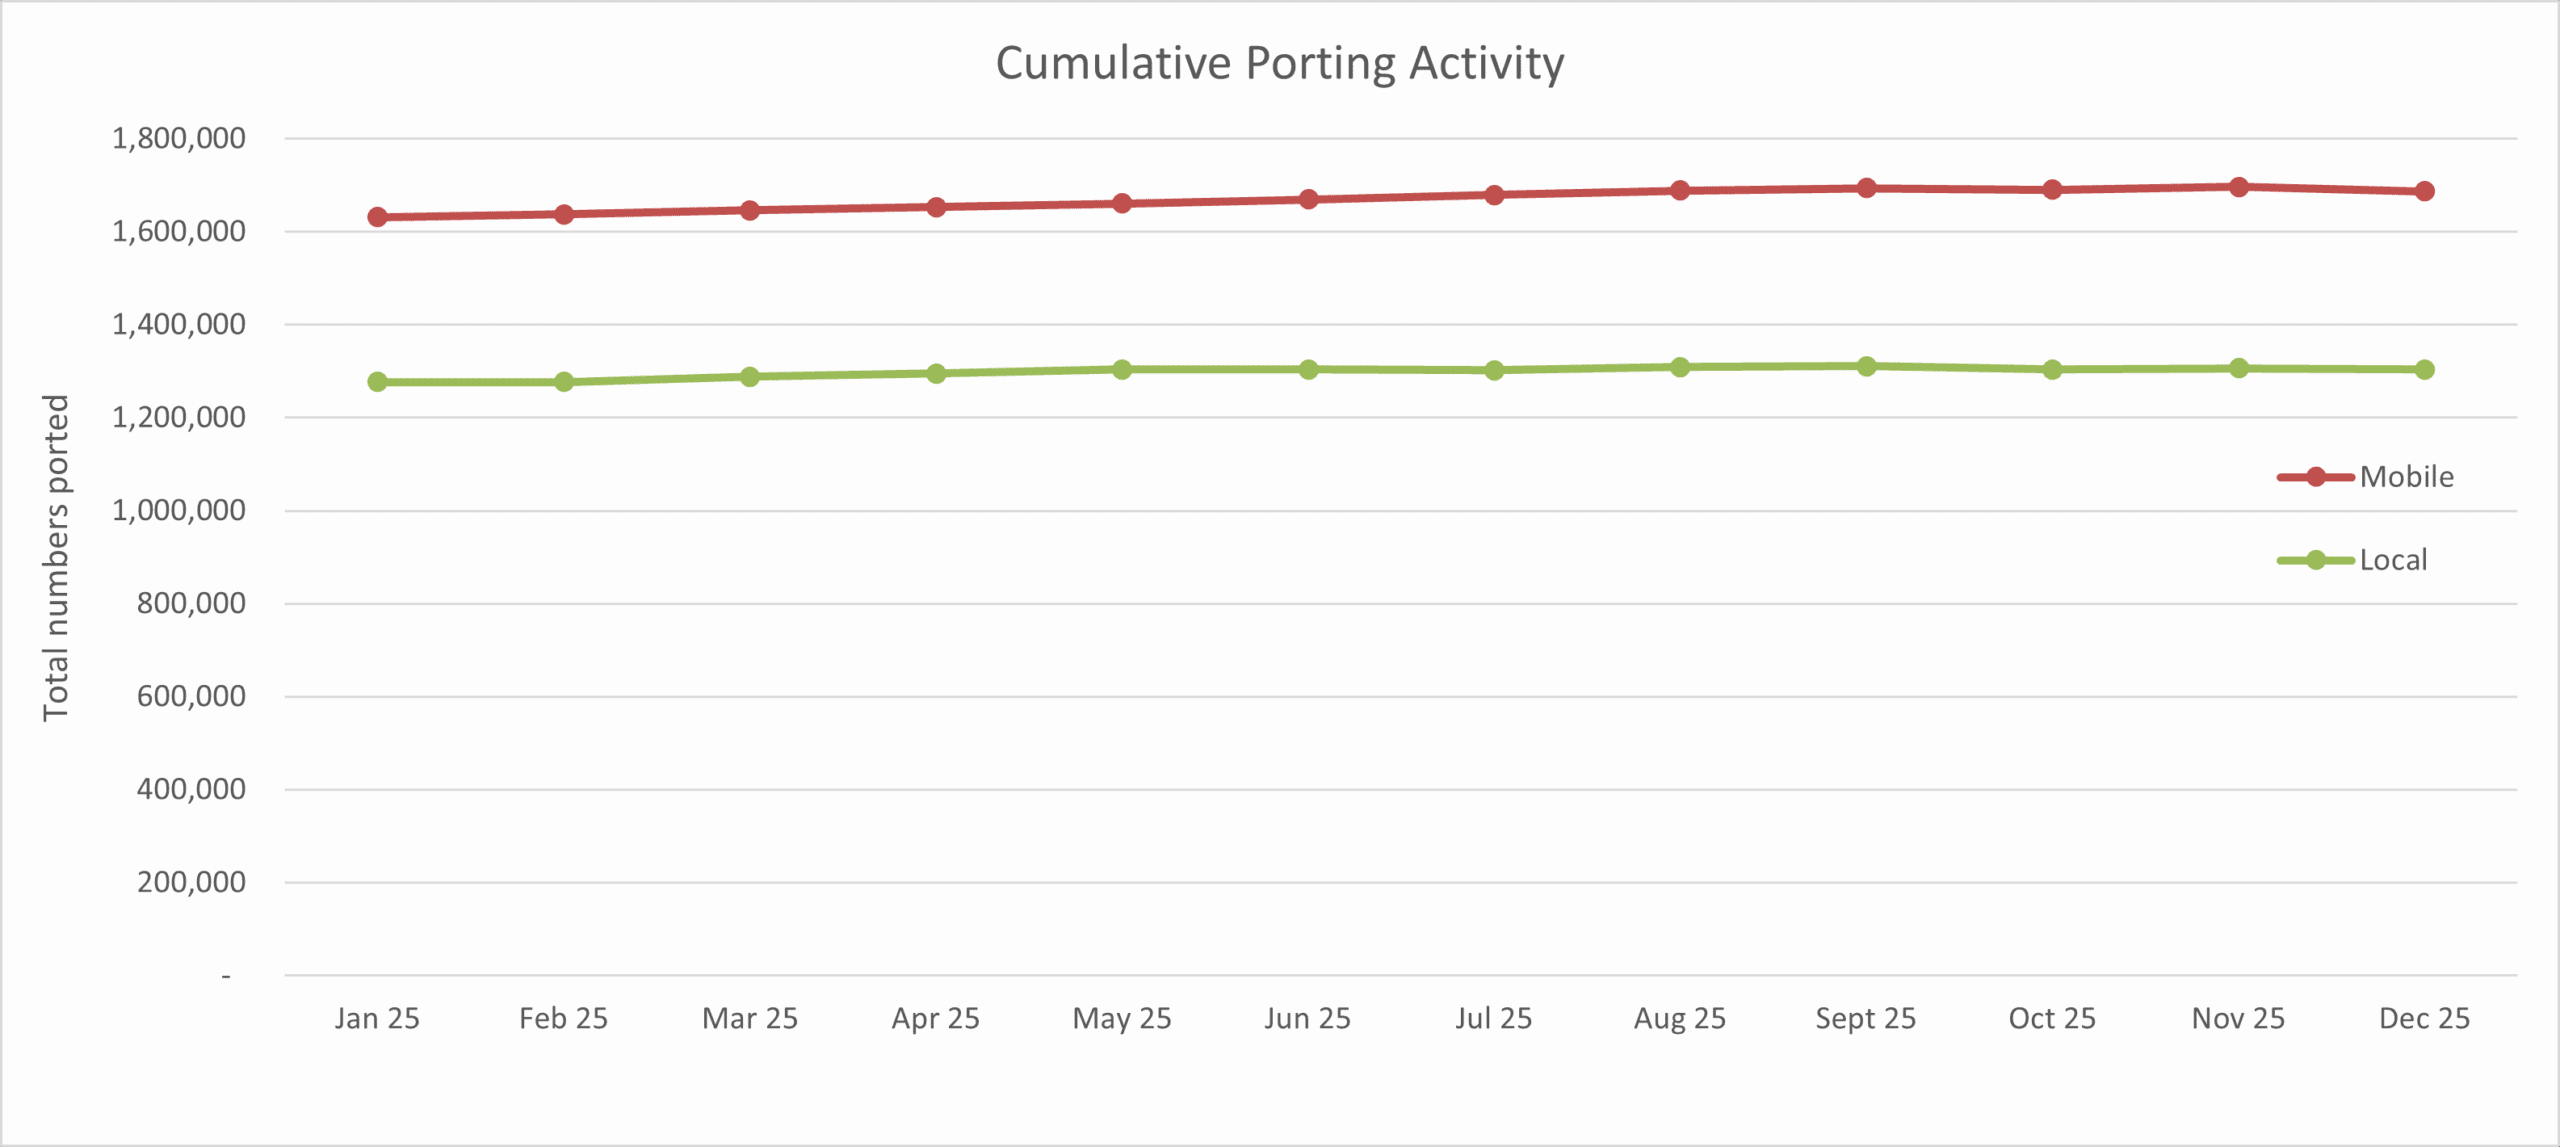
This graph shows how many numbers are ported at a specific time, i.e. how many numbers are with a different operator than the one they were originally with.
Cumulative count of numbers ported as a percentage of active numbers
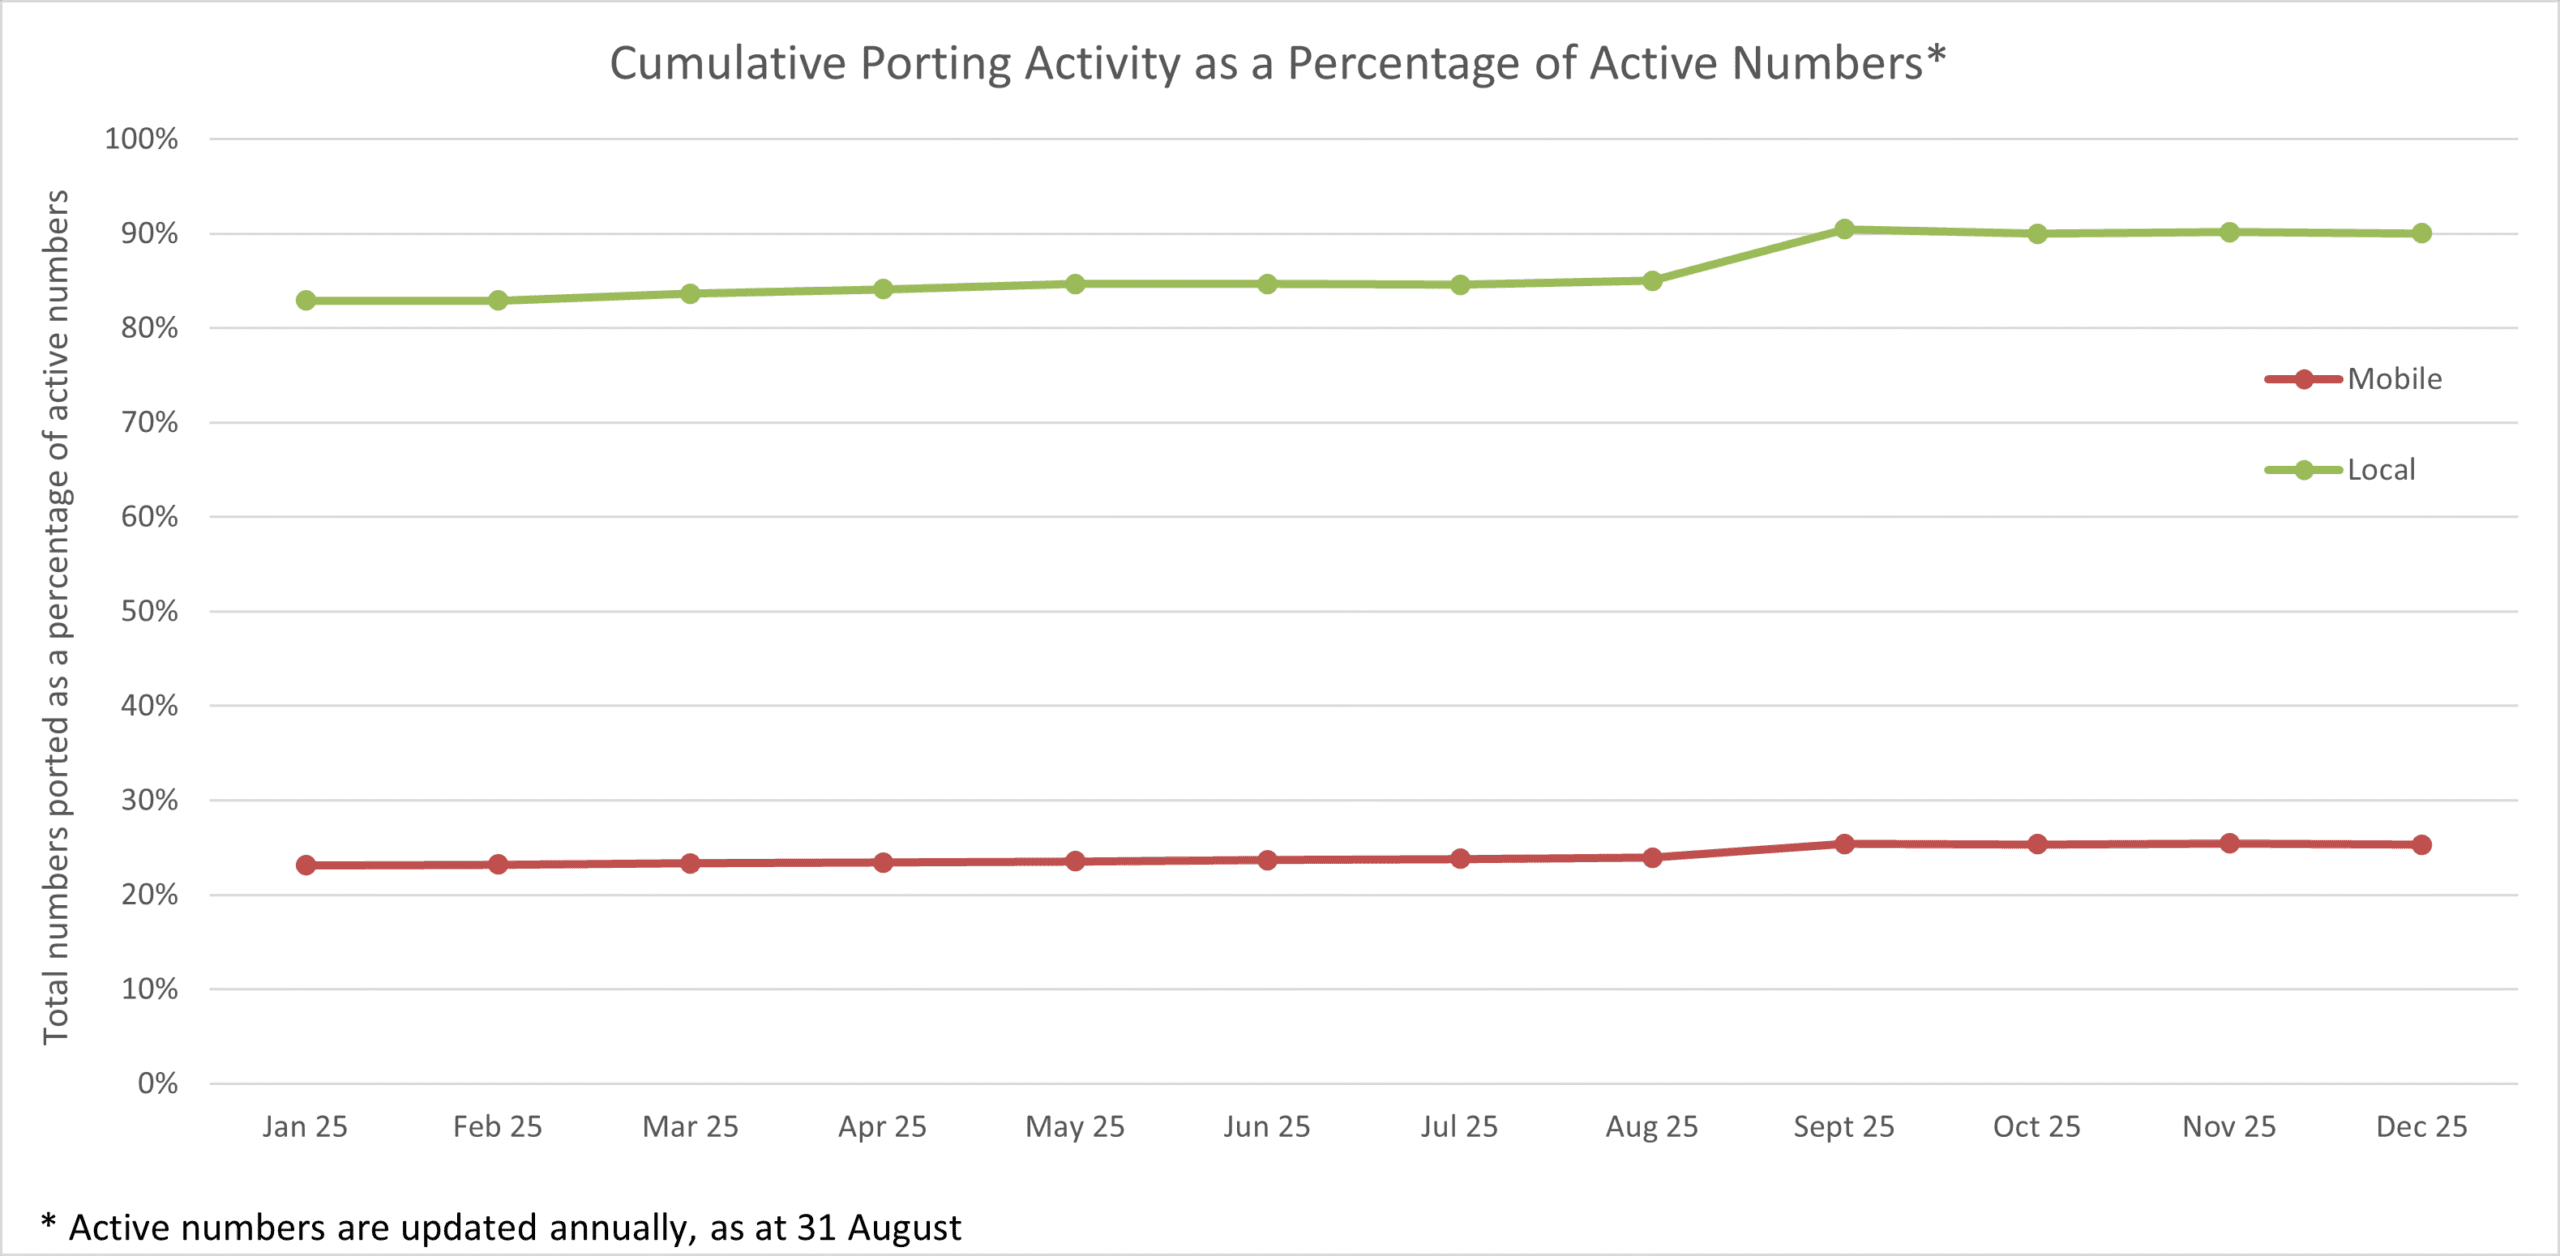
This graph shows how many numbers are ported at a specific time as a percentage of the total active numbers. The count of ported numbers is updated monthly; however, the count of active numbers is only updated annually, as at 31 August.
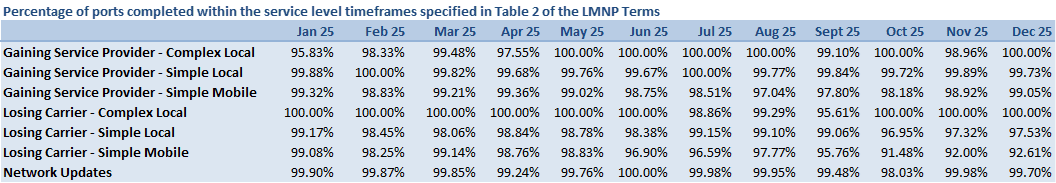
Percentage of ports completed within the service level timeframes specified in the LMNP Terms
This table shows the percentage of ports completed within the service level timeframes specified in the Determination. The data in this table has been broken down to show the percentage of ports that meet the service level requirements by gaining service provider and losing service provider and by port type, as well as network updates. This breakdown matches what is used for the monthly monitoring to determine when there has been a breach of service levels by a Party to the LMNP.